


 CONTACT: Roberto Verucchi (roberto.verucchi@imem.cnr.it, tel 0461-314825) ; Letizia Savio (letizia.savio@imem.cnr.it, tel 010-3536292)
X-Ray photoelectron spectroscopy (XPS)
Setup
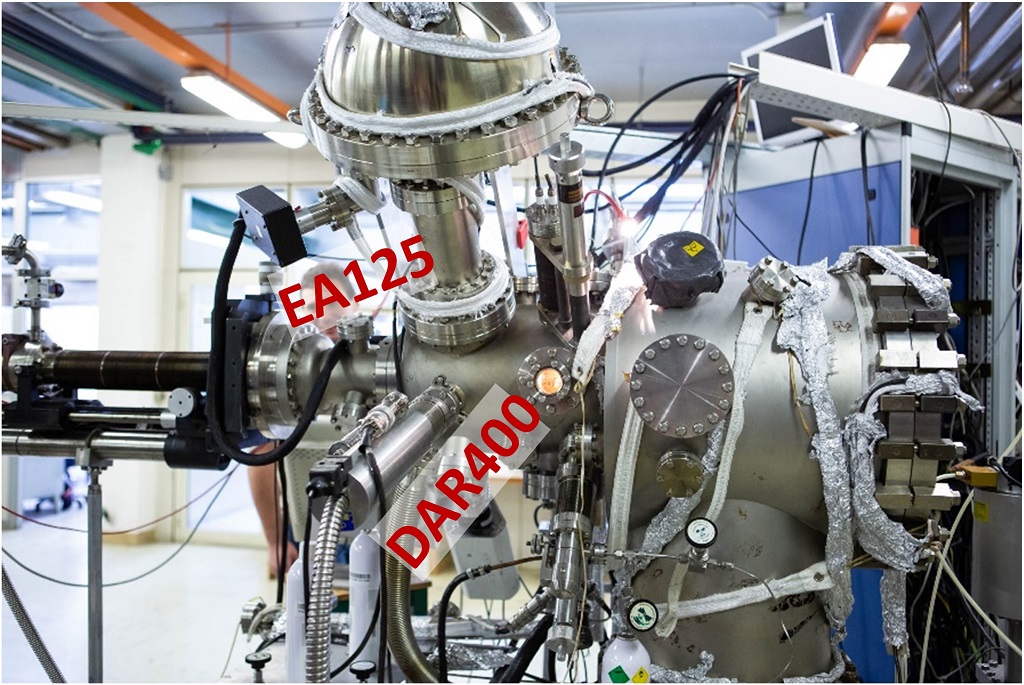
EA125 Omicron analyser @ IMEM-Genova
X-Ray source, DAR400 Omicron (Mg/Al anode, non monochromatic)
Installed on a UHV chamber with HREELS spectrometer and connectable to a supersonic molecular beam.
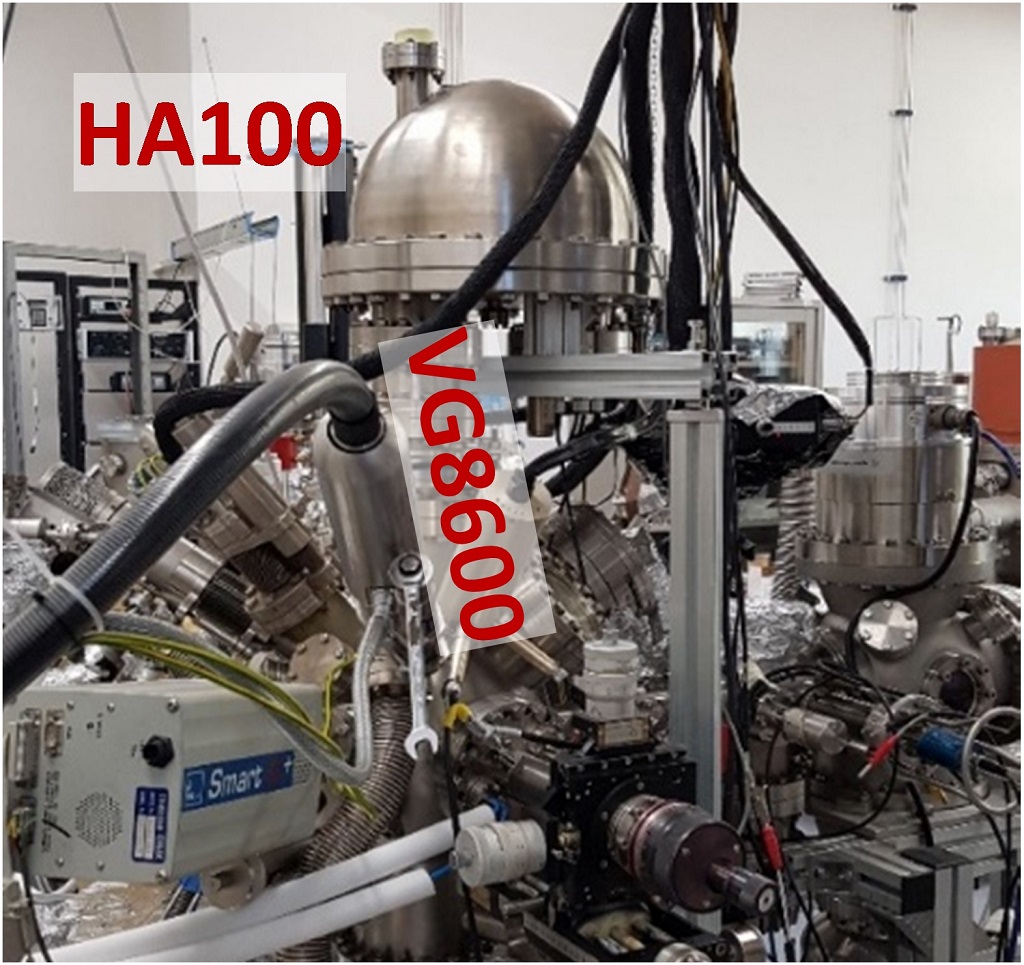
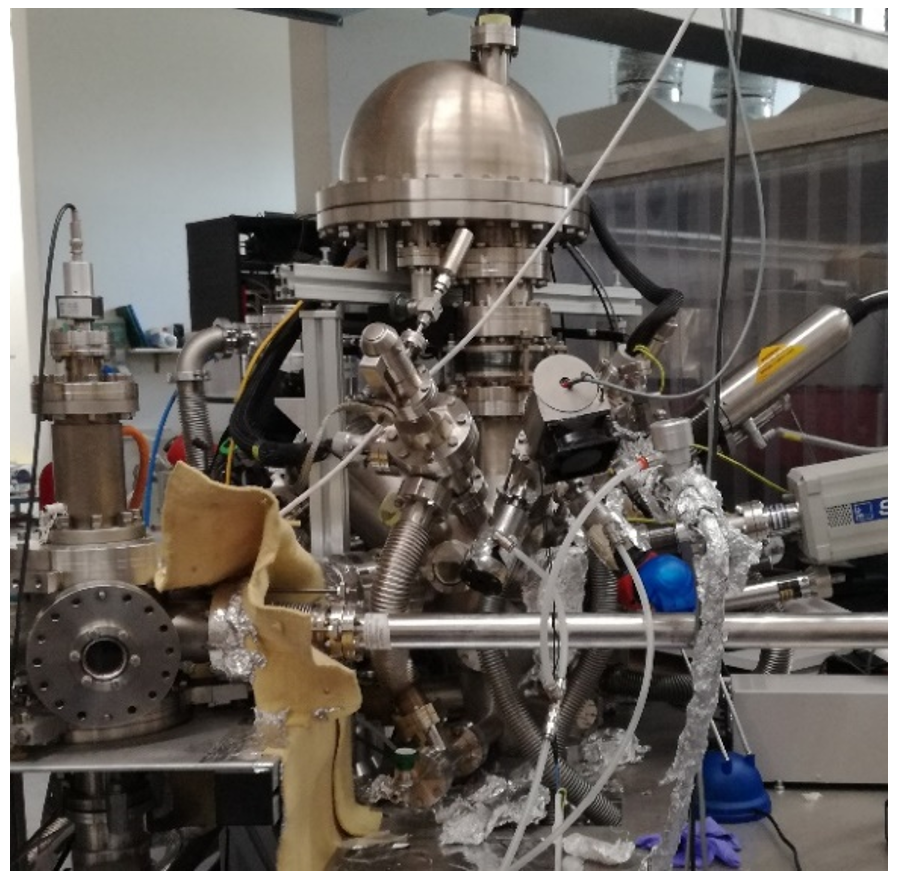
VSW HA100 analyser with control unit PSP @ IMEM-Trento
X-Ray source, VG 8600 (Mg/Al anode, non monochromatic). Ion gun VG EX05. UHV system, connected to a co-deposition chamber and to a supersonic beam source enabling in situ analysis of material growth processes.
Method
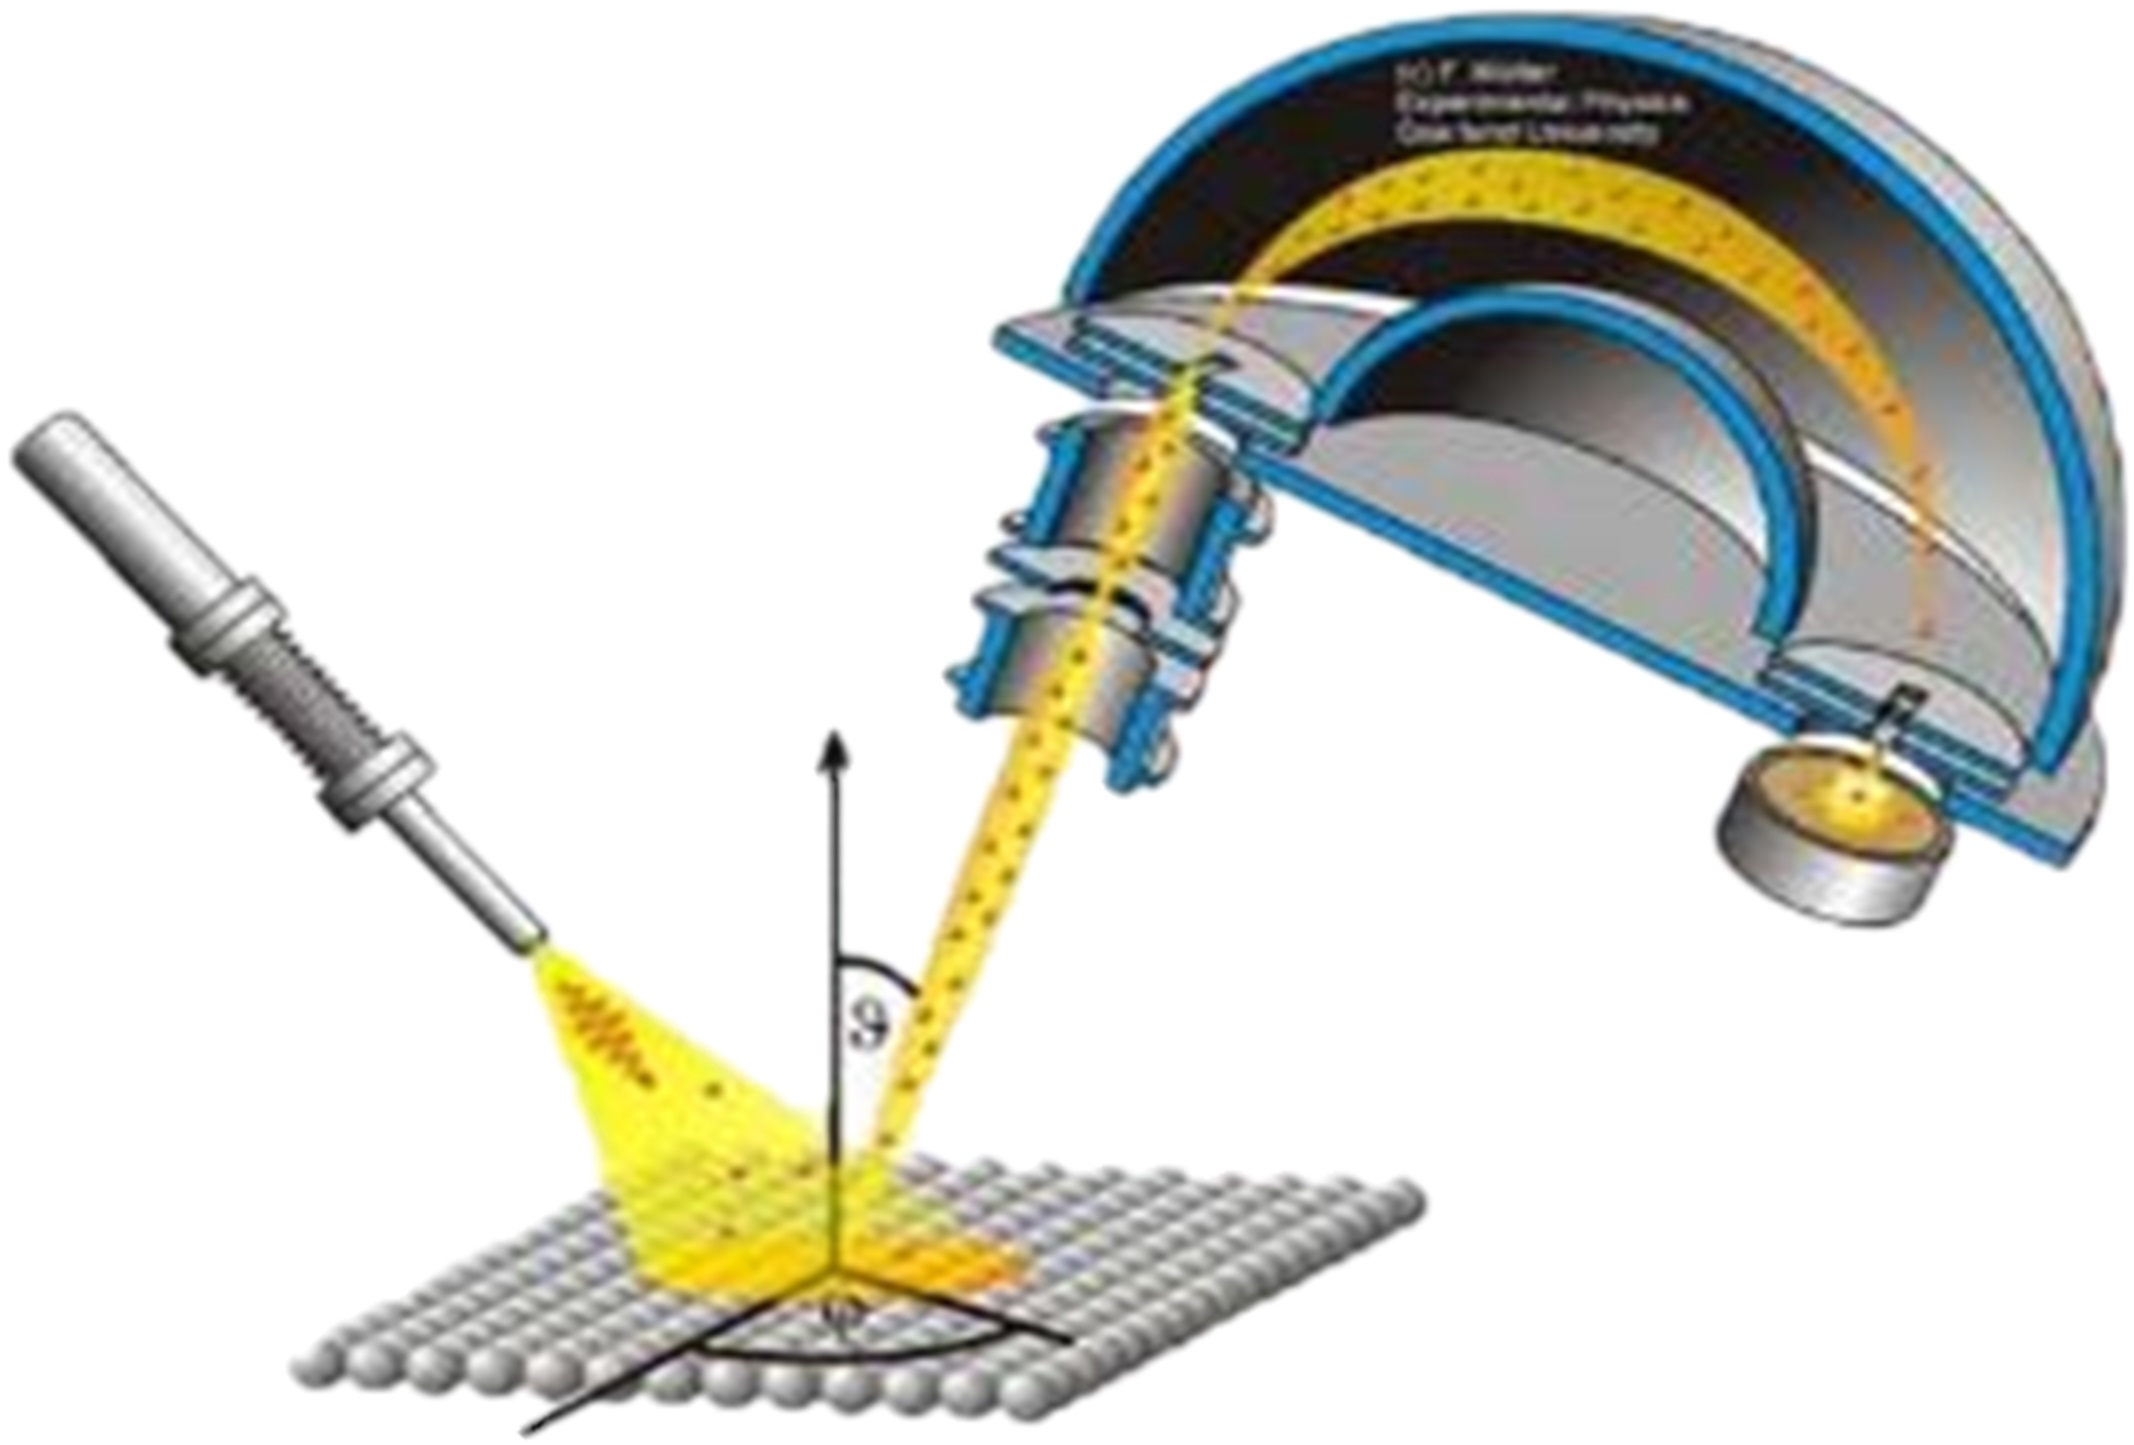
This spectroscopy exploits the photoelectric effect for the analysis of the surface composition. In fact, the electrons of the core levels are bound to the nucleus with a binding energy (Eb) characteristic of the element and of the occupied orbital. Therefore they are photo-emitted by the sample with a residual kinetic energy that makes them identifiable.
XPS is a surface-sensitive analytical technique. It can be applied to conductive and semiconducting samples and, using a neutralizer, even to insulators. It provides quantitative information on:
- Chemical composition of the surface
- Chemical state of atoms and molecules at the surface
Highlights
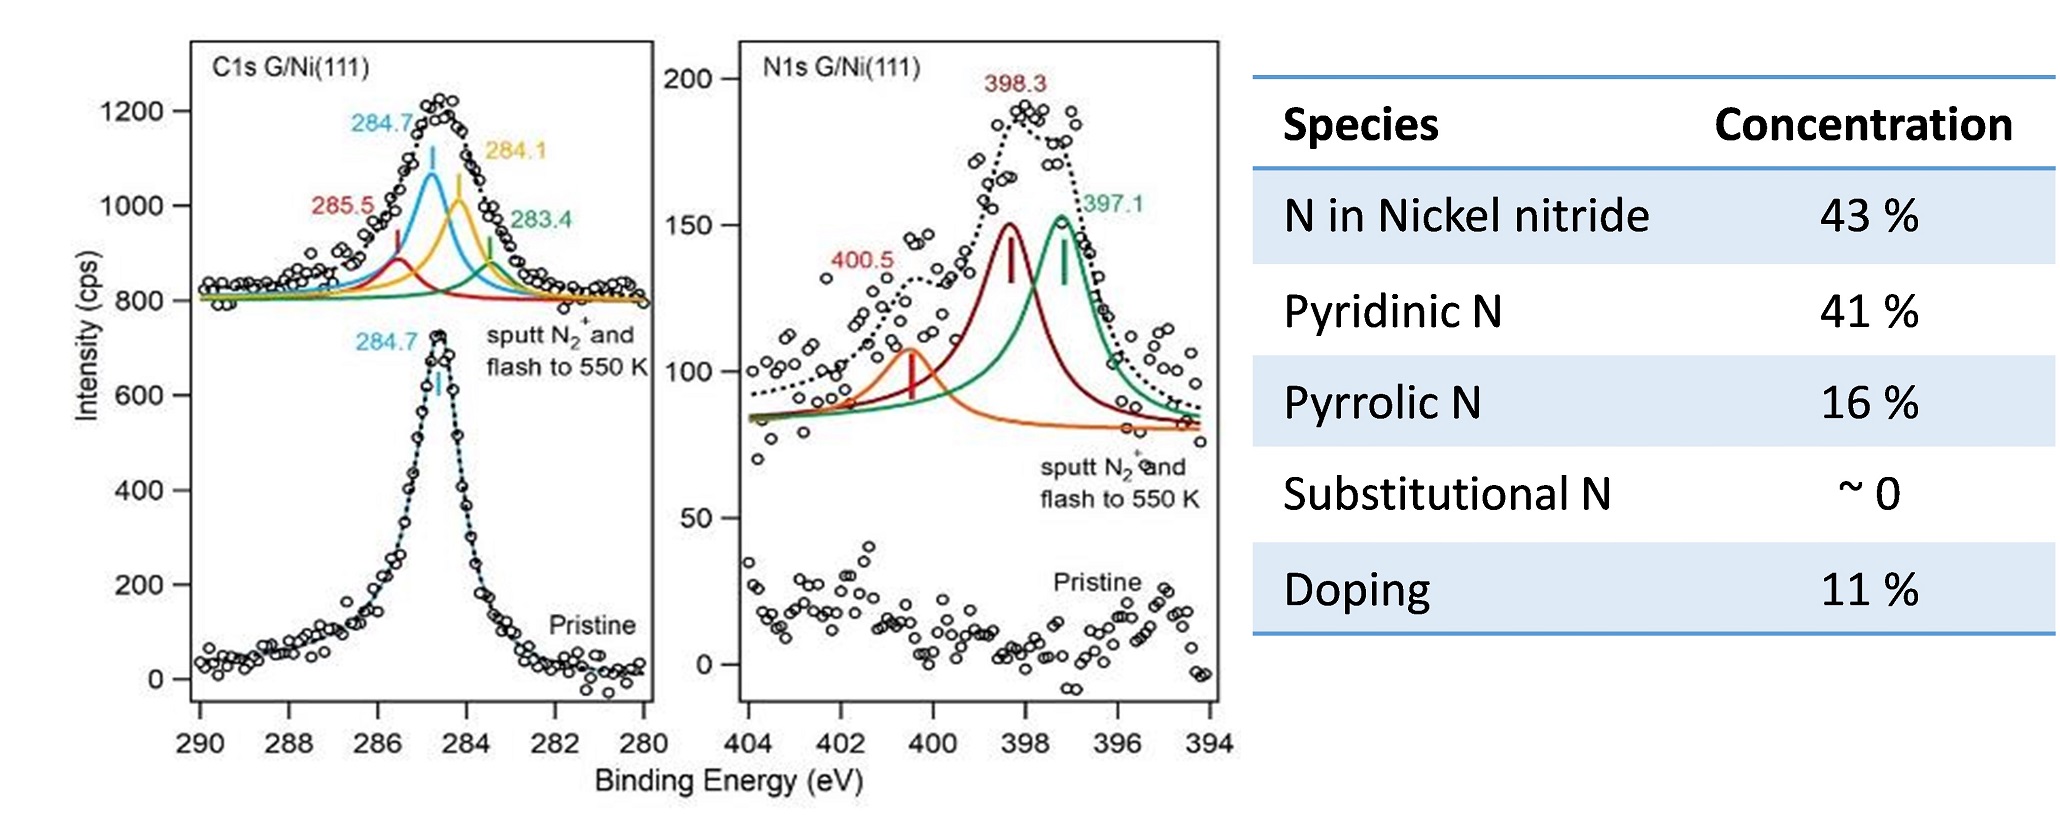
Identification and quantitative analysis of chemical species on organic or inorganic surfaces
Ultraviolet Photoelectron Spectroscopy (UPS)
Setup
Electron energy analyser VSW HA100 with control unit PSP @ IMEM-Trento
UV source: custom made He discharge lamp, non monochromatized
Photon energy: He I (21.22 eV), He II (40.81 eV)
Working discharge current: 25-100 mA
Spot Ø ~1 mm
Sample bias: -7 V
Method
UPS spectroscopy is based on photoelectric effect to analyze surface elctronic properties. The sampled electron energy levels are the most external ones, such as valence band for inorganics. Main informations that can be acquired are:
• Fermi level identification
• Material work function
• Ionization potential
• Distribution of valence band (molecular orbitals for organics) states
• Charge transfer processes.
When used together with XPS technique, it is possible to study formation of surface dipoles, band bending, charge accumulation.
It can be applied to conducting materials, as well as semiconductors (also with wide band gap), inorganics and organics. It can’t be used for highly insulating materials, or when degradation due to UV photon occurs. UPS requires sample negative polarization to enable electron energy analyzer proper working.
Highlights
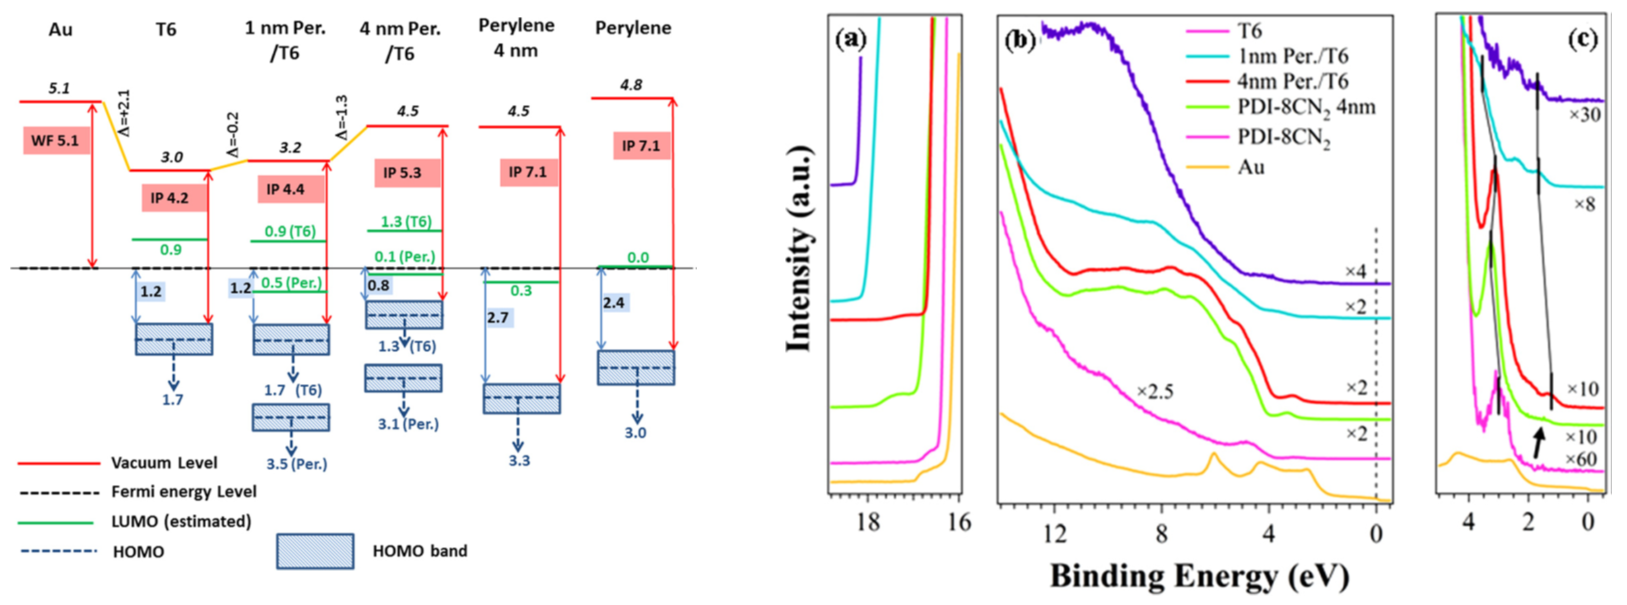
T6/PDI-8CN2 heterostructures on Au substrate: presence of a significant charge transfer from the T6 HOMO to the perylene LUMO. An accumulation layer of 5–6 nm in T6 layer can be estimated. Valence band evolution (right) and energy levels alignments (left) are shown. Refs: Appl. Phys. Lett. 2012; Appl. Phys. Lett. (2014)
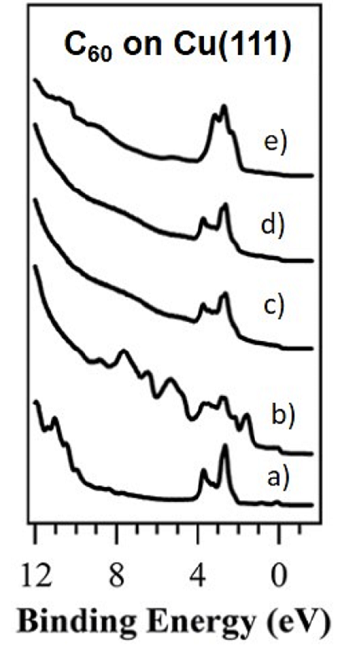
Ref: RSC Adv. (2016)
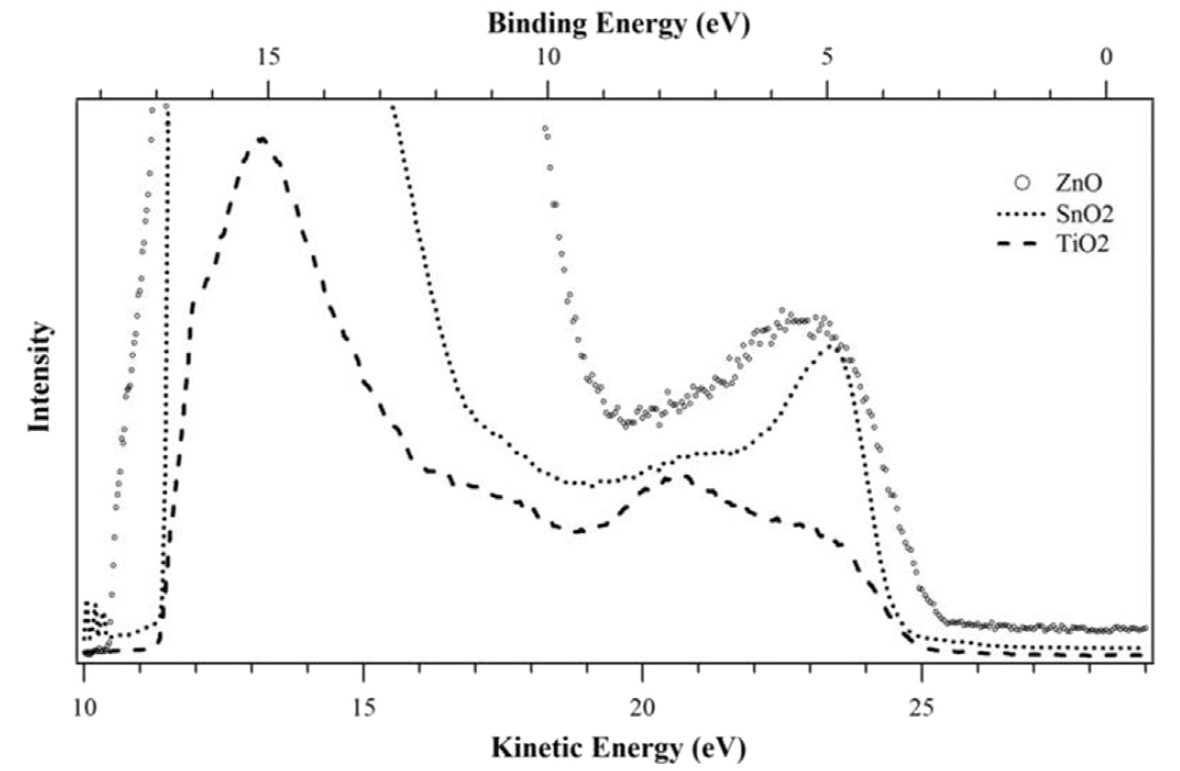
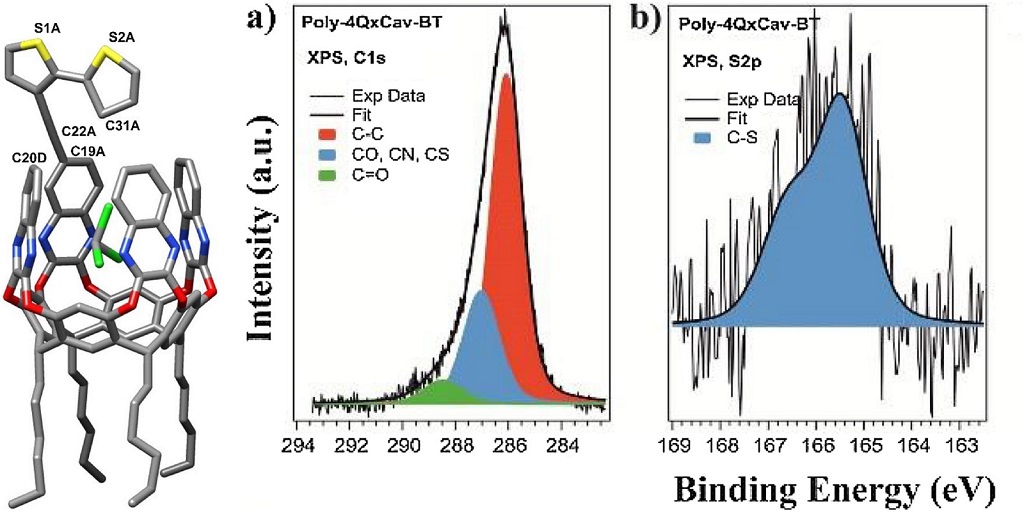
Ref: Opt. Mat. (2017)
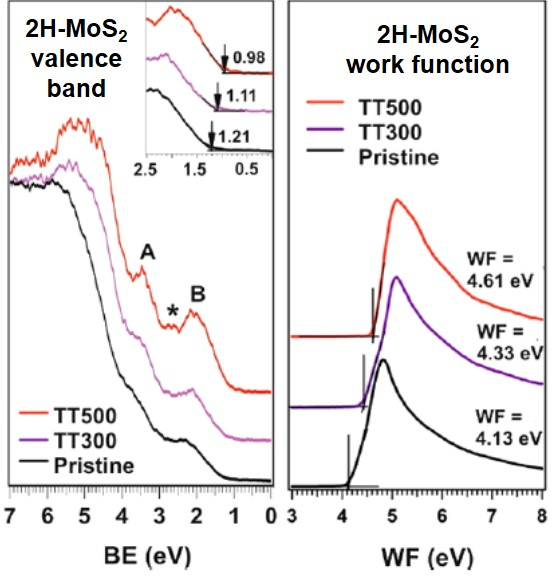
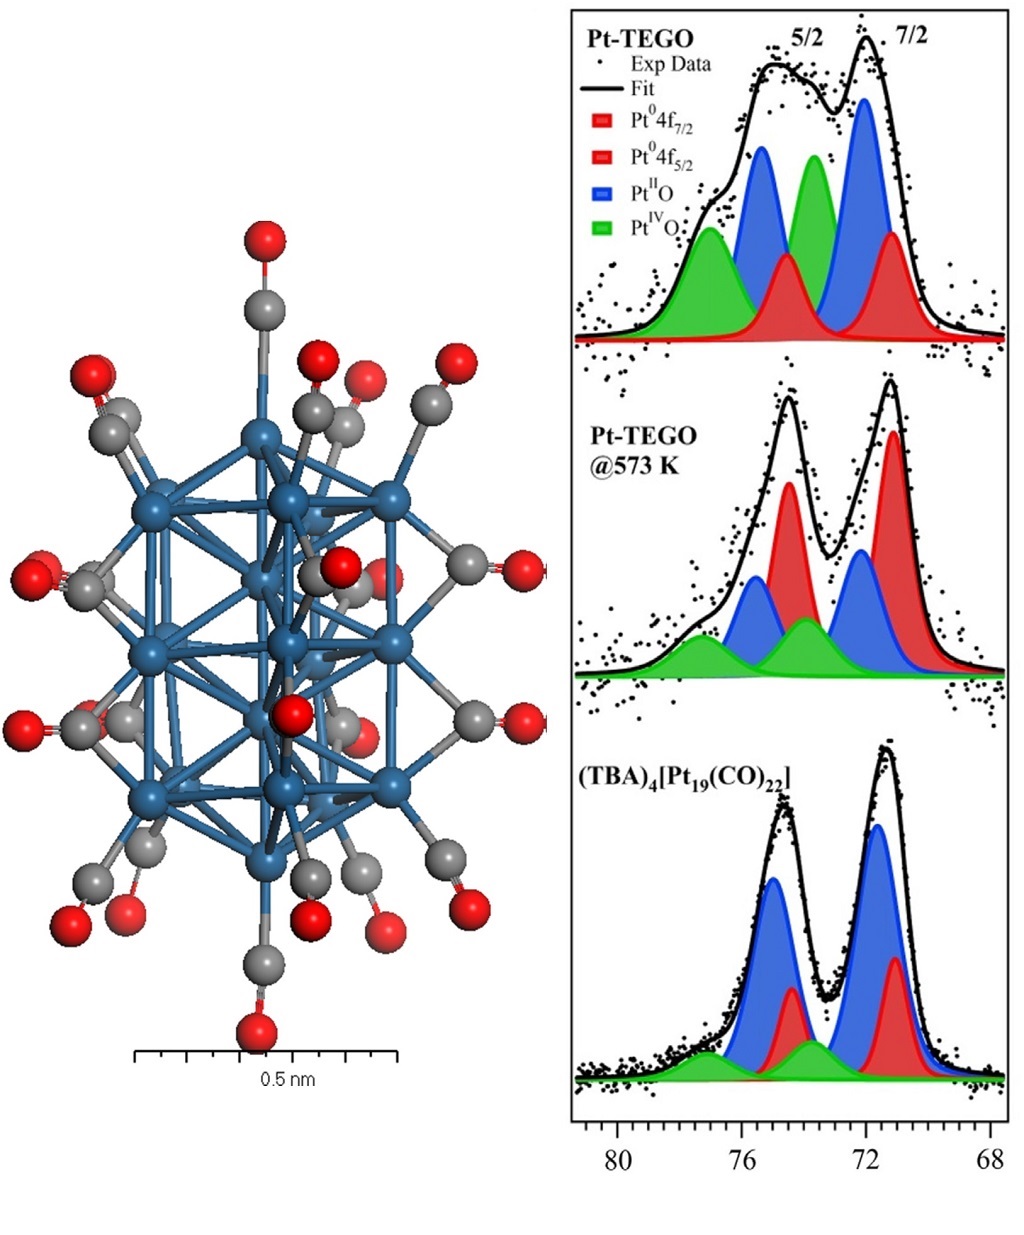
Ref: J. Phys. Chem. C (2020)